Infographics: Visualization of Data in BIRT Reports and Analysis
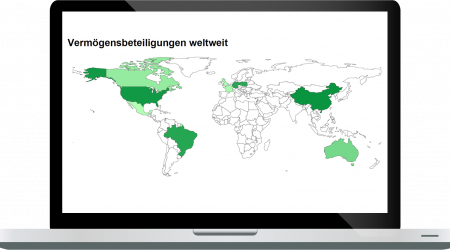
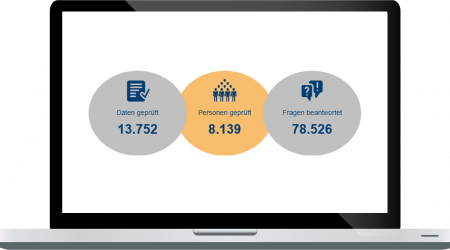
The BIRT plugin Infographics provides a graphical user interface. It allows easy creation and integration of SVG graphics in the shape of maps and other images for a better visualization of the data. This enables you to design your reports, the analysis and the evaluations in an easy to interpret and intuitive form.

Descriptive design using maps
The cartographic material used is based on the publicly available maps from Natural Earth. The standard maps included are: Global (World Map), Europe and Germany with its federal regions.
Visualization according to your needs
The Infographics plugin enables you to design a wide variety of images and shapes. You are able to visualize your values, your data and any information according to your requirements. This way, you get informative and easy-to-understand reports, as well as the corresponding analytics. Let us assist you, since we all know: A picture is worth a thousand words.


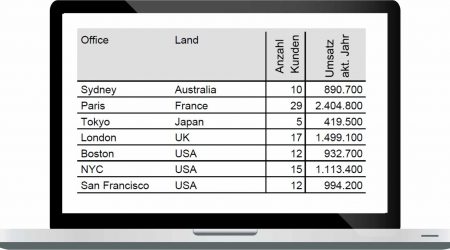
Displaying table legends in an upright format
In BIRT, texts in tables can only be displayed upright with a lot of work. With infographics, this is easily possible and thus saves you an enormous amount of your time!

