Skip to content

dashBIRD: Data visualization made easy - interactive and dynamic!

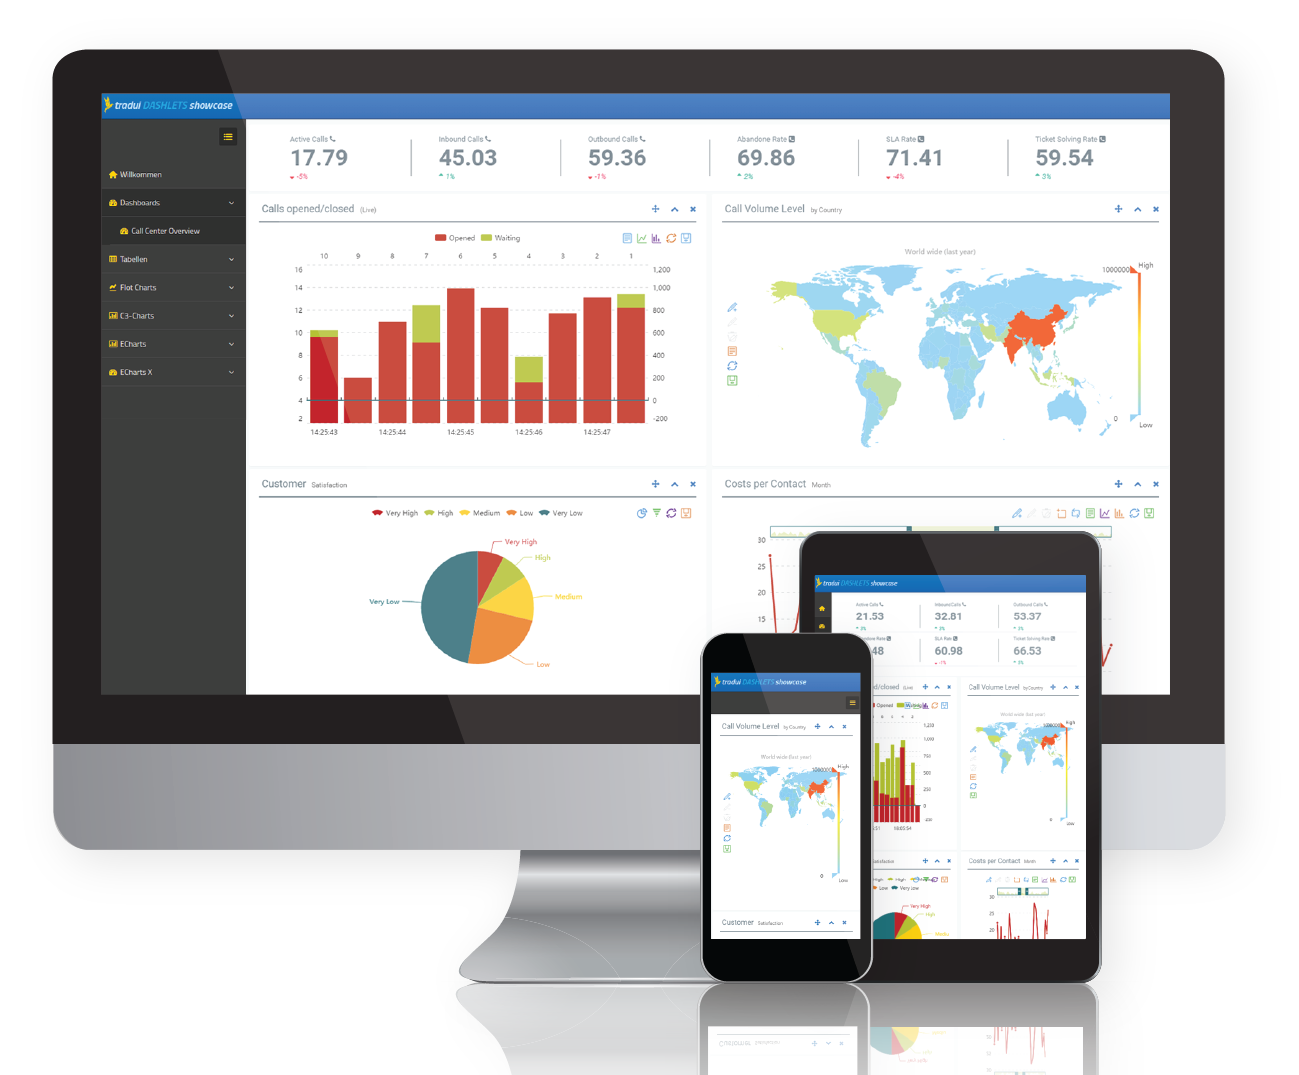
Whether in the area of digitalization or for corporate management, visual and easy-to-understand views of information form the very basis for short-term and strategic decisions. dashBIRD offers you exactly the tool you need for these tasks with its graphical visualization elements such as charts, tables, maps and KPIs as well as corresponding drilldown functions. The capability to combine dashboards and reports not only reduces the development effort, but also increases the informative nature of your reports.

Dashboard for data analysis

A dashboard consists of several visualization elements – so called dashlets. The ability to logically link the contents of dashlets allows you to visually display and analyze commercial interdependencies in real time.
2Mockups_PNGExport

For BIRT users

dashBIRD can be embedded as a plugin within BIRT. This enables you to use the data retrieval capabilities of BIRT and at the same time create interactive dashboards with simple function statements. We have therefore developed our own dashlets engine, which is run in parallel to the BIRT report engine.

Your advantages with dashBIRD

New insights through interactive exploration

The enduser can interactively filter data within the dashboard, zoom into data, limit time frames, display and hide streams of data and a lot more.

Export

Within the dashboard downloadable parallelly generated excel sheets, pdf etc. can be provided. Users are given even more opportunites to interact with the data and obtain further detailed views.

Snapshot

Save entire dashboards including interactivity as a zip file and send the status quo to your customers. Additionally, this gives you the opportunity for offline usage if there is no access to the report server.

Mobile-friendly with responsive design

All dashlet components are responsively designed. This way you can access your company’s dashboard on tablets or smartphones.

Extensive customizing possibilities

All elements can be customized in terms of shape, color, font and appearance. This allows you to establish the perfect look’n’feel for your specific corporate design.

Drill down- / modal dialog functions

Detailed views as drill down or modal dialogs allow information to be displayed compactly and offered to the user when needed.

Generating synergies

Create synergies by linking individual dashlets – e.g. to filter data for specific regions.

Fitted information

Reposition individual dashlets or hide information not important to you.

Minimal effort for your design

Use themes to globally control the default look with minimal efforts.

Request additional information

    I am interested in

    Your contact details


    MrMrs


    Title of the document


    * I have read the privacy policy. With sending this form I accept that my data is electronically gathered and stored to answer my enquiry. Notice: You can withdraw your consent at any time with effect to the future by sending an email to datenschutz@tradui.de


    Mandatory field *

    Back To Top
    Search